Market Research Analysis Made Easier with the New Dashboard
Redacción
3m of reading
To make the analysis of market studies easier for you, we have just released our new dashboard. A panel designed for you, our clients and businesses, where you can manage the data and results of your market studies in a much more efficient and agile way.
More Intuitive Market Study Analysis
And you might be wondering… what are the main advantages? Well, after many hours of work from our wonderful development and design team… Here they are! We are launching the first list of benefits for this new academic year, highlighting the main ones:
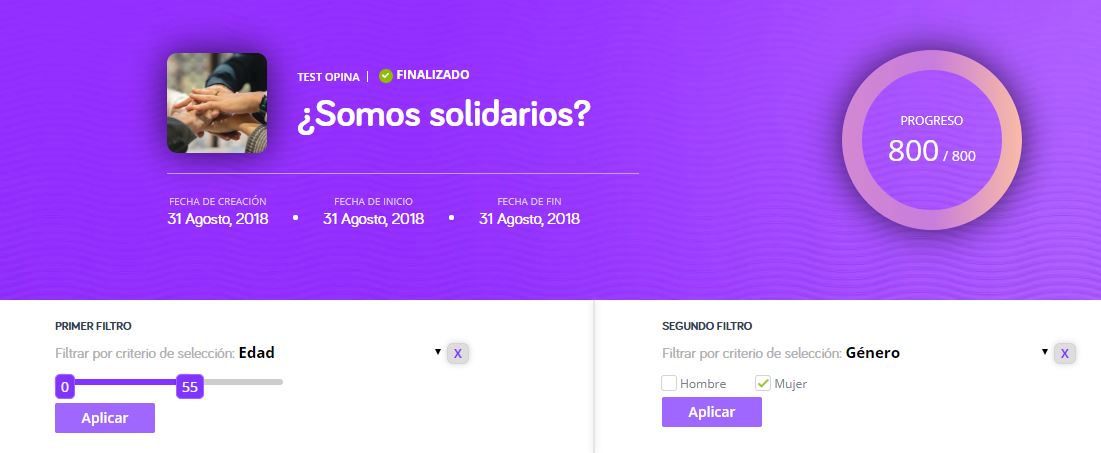
For beginners and data analytics experts alike. This is a data analytics tool that allows you to evaluate the responses obtained in your market research in a simple and intuitive way, regardless of your level of statistical or market research knowledge. This means that, beyond a spreadsheet full of data, we present you with a dashboard where you can see and analyze, with a simple click, the results of your study in a very visual, attractive, and real-time manner, as well as key information about your research (response progress, creation and completion dates, number of testers, and questions…). And if you’re passionate about data analysis, thanks to this new dashboard, it will be much easier for you to cross variables and segmentation criteria to reach the exact conclusions and results you want to obtain.
More Visual Market Study Analysis
What do women in Madrid aged 20 to 35 think of my brand? Thanks to our new dashboard, you’ll have the answer to all your questions in a matter of seconds. Play around with segmentation criteria and filters applied to each of your survey questions to obtain as segmented and rich information as you desire.
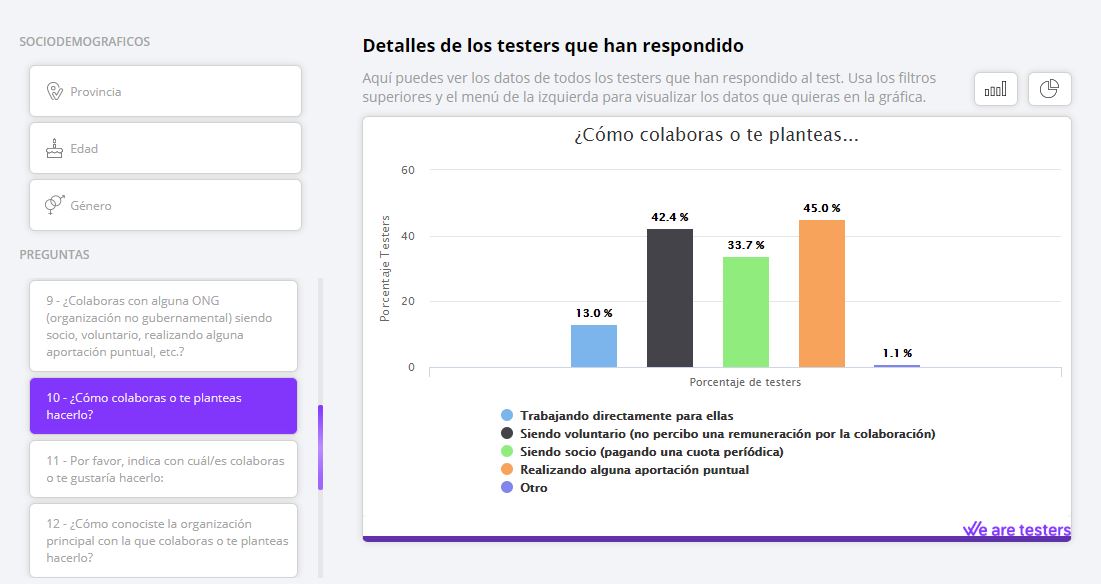
A picture is worth a thousand words. The new dashboard enhances market study analysis with visual graphs. It now presents study data in bar or pie charts in an environment designed to make your experience as enjoyable as possible.
Create your own reports. Thanks to this new market study analysis tool, you can generate specific material that interests you and create your own reports and presentations.
And we haven’t forgotten the testers. Perhaps your situation is that, in addition to being a company/client, you are one of the 75,000 users who are part of our user community. In that case, we have some exciting news for you: in the coming weeks, we will also be launching a new dashboard designed for testers, which is much more gamified and includes all the information about their progress in the community, remuneration, and specific content to maintain that special commitment we have built with them/you.
This is just the first step! We are developing new features and designs to make the most of it. Soon, we will share more news about market study analysis that we will reveal as they are ready to put the finishing touch on our company dashboard.
We hope you like this new feature as much as we do and, above all, that it is very useful for your market study analyses. If you think we missed something, if there is something you don’t understand, or if you believe we could improve, write to us in the comments or at info@wearetesters.com with your suggestions. We can’t wait to hear from you!
Update date 22 December, 2023
Get in touch with our experts and discover how to take your research further.
At We are testers, we have a community of users who participate in various types of research tests. They are our panelists or testers. Just as we design each test according to specific needs, we also ...
If you conduct market research in Portugal, we have good news for you. Today, we have announced the launch of a new consumer panel to make your market research in Portugal and your UX tests even bette...
If you enjoy creating your own surveys, you'll love the enhancement we've just introduced at We are Testers. Now, all users can enjoy the ability to conduct international surveys directly on our platf...
We use our own and third-party cookies to analyze the use of the website and improve users browsing experience. More information at the Cookie policy
Functional
Always active
The storage or technical access is strictly necessary for the legitimate purpose of enabling the use of a specific service explicitly requested by the subscriber or user, or for the sole purpose of carrying out the transmission of a communication over an electronic communications network.
Preferences
The storage or technical access is necessary for the legitimate purpose of storing preferences that are not requested by the subscriber or user.
Statistics
The storage or technical access that is used exclusively for statistical purposes.El almacenamiento o acceso técnico que se utiliza exclusivamente con fines estadísticos anónimos. Sin un requerimiento, el cumplimiento voluntario por parte de tu Proveedor de servicios de Internet, o los registros adicionales de un tercero, la información almacenada o recuperada sólo para este propósito no se puede utilizar para identificarte.
Marketing
The storage or technical access is necessary to create user profiles to send advertising, or to track the user on a website or across several websites for similar marketing purposes.