Cross-tabulation. Create your own tables and easily analyze the data.
Redacción
4m of reading
The cross table or cross-tabulation is one of the most commonly used deliverables in market research. In this article, we’ll explain what cross tables are and how you can use them to analyze the results of your studies.
What Are Cross Tables?
Cross tables are a way to summarize and analyze data. Imagine a table with rows and columns. In the rows, we place all the questions from the market research study, and in the columns, we include different sociodemographic data cuts, such as regions (North, Central, South…). At the intersection of rows and columns, we have the frequency of each response for each cut of the sociodemographic variable (in each region, following the previous example). This allows us to understand if a response is more frequent in some regions than others, helping us identify patterns in responses that can inform decision-making.
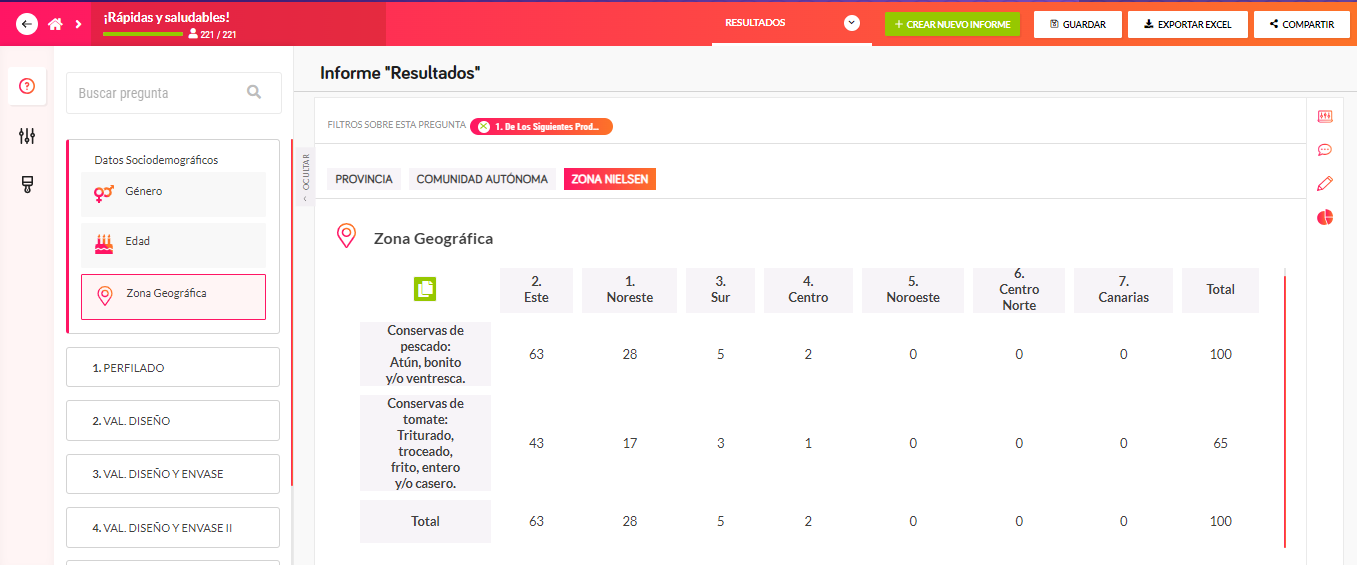
Example of a cross table in We Are Testers
How to Create Cross Tables?
To create cross tables, you need to decide what information goes in the rows, what columns you’ll use, and what frequency variables you’ll use at the intersections.
In the rows, you usually place the questions and answer options from the market research study.
In the columns, you can use different types of data:
Sociodemographic data. These data allow you to see how often certain responses occur in your study for each sociodemographic group. Generally, in an online market research study, consumer panels with known sociodemographic data are used, so you can easily select the ones that interest you and place them in the columns.
Data from a study question. Imagine you want to filter survey results, not by the characteristics of the people in the sample that you already know but by the results of a question from the same questionnaire. For example, you may want to analyze responses to a NPS question that indicates the likelihood of recommending a brand from each respondent, or by the frequency of product use to understand differences between Heavy, Medium, and Light users.
Combination of study variables. You can also place the results of a multivariate analysis in columns, which may have allowed you to segment the sample into different groups of people.
Finally, you have to decide which variables to use at the intersections:
Respondent count. This allows you to quickly see how many people from the sample are in each cell, helping you detect when there are values too low to be considered.
Population size. It’s also an absolute number, but it has been weighted and extrapolated beforehand to represent the reference population. This variable tells you how many people in the market fall into each intersection.
Percentage. It’s undoubtedly the most commonly used variable as it allows for a direct comparison between cells in the table. Imagine you have chosen to create columns for regions and want to use vertical percentages. In this table, the total of each column is 100%, regardless of its absolute volume. This way, you can compare columns and find out if the population in one region chooses a response option more frequently than in other regions. For example, whether they are more satisfied with the product, if they prefer a certain concept for a new product, or if they buy a particular product more frequently in stores, always in comparison to other regions.
Keep these options in mind for your analysis and create your tables to suit your needs.
Cross Tables in We are testers?
With We Are Testers, you have a powerful data analysis tool to intuitively visualize the responses of your online market research studies. The tool allows you to create all types of charts, apply filters, switch axes, add comments, customize the interface with your own branding, and much more.
If you want to view the data in a cross table, click on each chart on the button with a small table icon, and you’ll be able to see it on the screen. Choose the columns you want, including sociodemographic data or responses from previous questions.
If you prefer to analyze using cross tables with other software of your choice, you can download the data file in MS Excel and create the tables in Excel itself or load the file into any other software you prefer.
How to create your own cross tables
Have questions about how to access or download your cross tables? Get in contact with our experts, and they’ll help you achieve what you need.
Update date 15 April, 2024
Get in touch with our experts and discover how to take your research further.
"Ideas worth spreading." That's the motto of TED (Technology, Entertainment, Design), a non-profit organization that aims to provide a platform for individuals with something interesting to share and ...
The winners of the Premios Eficacia, the leading event in the field of advertising effectiveness in Spain, have been announced these days. This year, the Grand Efficacy Award went to the automotive br...
Survey respondents are a very important factor in achieving better quality market research. Selecting them properly and working with them in an optimal way will help you to get better data. Here we gi...
We use our own and third-party cookies to analyze the use of the website and improve users browsing experience. More information at the Cookie policy
Functional
Always active
The storage or technical access is strictly necessary for the legitimate purpose of enabling the use of a specific service explicitly requested by the subscriber or user, or for the sole purpose of carrying out the transmission of a communication over an electronic communications network.
Preferences
The storage or technical access is necessary for the legitimate purpose of storing preferences that are not requested by the subscriber or user.
Statistics
The storage or technical access that is used exclusively for statistical purposes.El almacenamiento o acceso técnico que se utiliza exclusivamente con fines estadísticos anónimos. Sin un requerimiento, el cumplimiento voluntario por parte de tu Proveedor de servicios de Internet, o los registros adicionales de un tercero, la información almacenada o recuperada sólo para este propósito no se puede utilizar para identificarte.
Marketing
The storage or technical access is necessary to create user profiles to send advertising, or to track the user on a website or across several websites for similar marketing purposes.