Sampling error and market research data reliability
Redacción
5m of reading
When a manager faces the decision-making process, whether it’s strategic or tactical, regarding their business, there is always a certain level of uncertainty about the possibility of making the right decision. Market research data helps reduce this uncertainty.
To maximize the accuracy of decision-making, it is crucial to have reliable data derived from the information available prior to making that decision. Much of the information considered and significant at the moment of truth comes from the manager’s own experience, education, internal company information, intuition, etc. However, in many cases, that alone is not sufficient, and it’s necessary to supplement existing information with more relevant data that the manager does not have readily available. This is where market research data comes into play; when you need relevant information from the market (consumers) to minimize the risk of error in making an important decision.
But how can we be sure that market research data will be completely reliable and, therefore, significantly contribute to making the right decision?
Key Concepts Regarding Market Research Data
In this post, we will go over the concepts and best practices that will ensure the data provided by our market research study is truly reliable and relevant.
Let’s start by clarifying some concepts that we need to understand before beginning our quantitative research.
We must accurately know what our Universe is. We define Universe as the total individuals that make up the potential informant population. For example, if my product or service is aimed at people aged 25 to 45 who drink coffee daily, my Universe would be the total men and women of those ages residing in Spain who consume coffee daily.
Since my Universe is usually very large, I cannot survey all potential informants. Therefore, I will have no choice but to survey a Sample of them. We understand Sample as a more or less small part of the total potential informants (Universe). This sample will be the one I consult and from which I will obtain data that I will later extrapolate to the entire Universe.
This Sample should, in turn, be as representative as possible of our Universe. This means that if my Universe is composed equally of men and women, in my Sample, I would want to have 50% men and 50% women. And, continuing with the coffee example, if 15% of the population drinks only coffee, and 85% mixes it with milk, I would want my sample to include 15% of individuals who drink coffee alone and the rest with milk. I will do the same with all variables that characterize my Universe and that I consider relevant for the research.
At this point, we have come across one of the key questions we always face in a quantitative market research study: How many people should I ask? Or, in other words, what should be the size of my Sample?
The sample size will depend on the maximum Sampling Error we are willing to accept in our research. Sampling Error can be defined as the error we make by surveying a sample instead of the entire potential informant population. If I could survey the entire potential informant population (i.e., my Universe in full), the error in my research would be 0%.
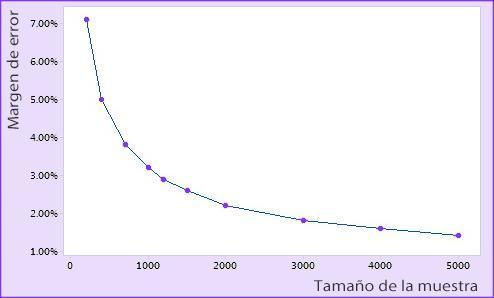
Sampling Error, for large Universes (composed of more than 30,000 members), behaves as shown in the following image.
As seen in the image, with a larger sample size (number of respondents), the error we make is smaller. However, the Sampling Error does not decrease proportionally to the increase in surveys conducted. Therefore, we must consider the cost-benefit ratio when designing our sample size because there will come a point where, no matter how much we increase the number of surveys, we will hardly reduce the Sampling Error.
In marketing research, it is common for the Sampling Error to be below +/-5% (for a 95% Confidence Level and for the most unfavorable case of p=q=0.5) to consider the data reliable enough to base decisions on those data, especially for large Universes, above 30,000 members. For large Universes, you can achieve this Sampling Error with a Sample composed of 400 individuals.
Thus, it could be concluded that, for any research with a large Universe, conducting 400 surveys would be sufficient to obtain reasonably reliable market research data.
Segmentation of market research data
However, this is not always the case. We must also consider the segmentations we want to apply to our data during analysis. For example, in our study on coffee consumption, if our sample size is 400, we will have data with a low Sampling Error (below +/-5%).
If we want to segment our data by gender to see if there are differences in behavior between men and women, the data we provide for men will be based on a number of surveys of 200, and the data for women will be based on another 200. In this case, the data for each segment, based on 200 surveys, rises to almost +/-7% (for a 95% Confidence Level and for the most unfavorable case of p=q=0.5). If we were to perform more extensive segmentations, such as by age divided into 4 groups, the Sampling Error of the data for each segment will increase depending on the sample size of each of those segments.
Therefore, before defining the size of our Sample, we must consider what types of segmentations we want to make during our analysis to try to define sample sizes that are large enough for each segment to obtain reliable market research data for each of them.
So, now you have all the necessary information to start your research with the certainty that the market research data you will obtain will be statistically representative of your Universe.
If you need more help starting a market research study, don’t hesitate to contact We are testers.
Update date 14 April, 2024
Get in touch with our experts and discover how to take your research further.
"Ideas worth spreading." That's the motto of TED (Technology, Entertainment, Design), a non-profit organization that aims to provide a platform for individuals with something interesting to share and ...
The winners of the Premios Eficacia, the leading event in the field of advertising effectiveness in Spain, have been announced these days. This year, the Grand Efficacy Award went to the automotive br...
Survey respondents are a very important factor in achieving better quality market research. Selecting them properly and working with them in an optimal way will help you to get better data. Here we gi...
We use our own and third-party cookies to analyze the use of the website and improve users browsing experience. More information at the Cookie policy
Functional
Always active
The storage or technical access is strictly necessary for the legitimate purpose of enabling the use of a specific service explicitly requested by the subscriber or user, or for the sole purpose of carrying out the transmission of a communication over an electronic communications network.
Preferences
The storage or technical access is necessary for the legitimate purpose of storing preferences that are not requested by the subscriber or user.
Statistics
The storage or technical access that is used exclusively for statistical purposes.El almacenamiento o acceso técnico que se utiliza exclusivamente con fines estadísticos anónimos. Sin un requerimiento, el cumplimiento voluntario por parte de tu Proveedor de servicios de Internet, o los registros adicionales de un tercero, la información almacenada o recuperada sólo para este propósito no se puede utilizar para identificarte.
Marketing
The storage or technical access is necessary to create user profiles to send advertising, or to track the user on a website or across several websites for similar marketing purposes.